Platform Visual Tour
Explore the core interfaces of Hookmetry. Our platform is designed to give you complete visibility and control over your webhook infrastructure, from initial receipt to advanced signature forensics.
1. The Telemetry Dashboard
Get a birds-eye view of your webhook health, identify failing endpoints instantly, and monitor your request volume over time.
.png)
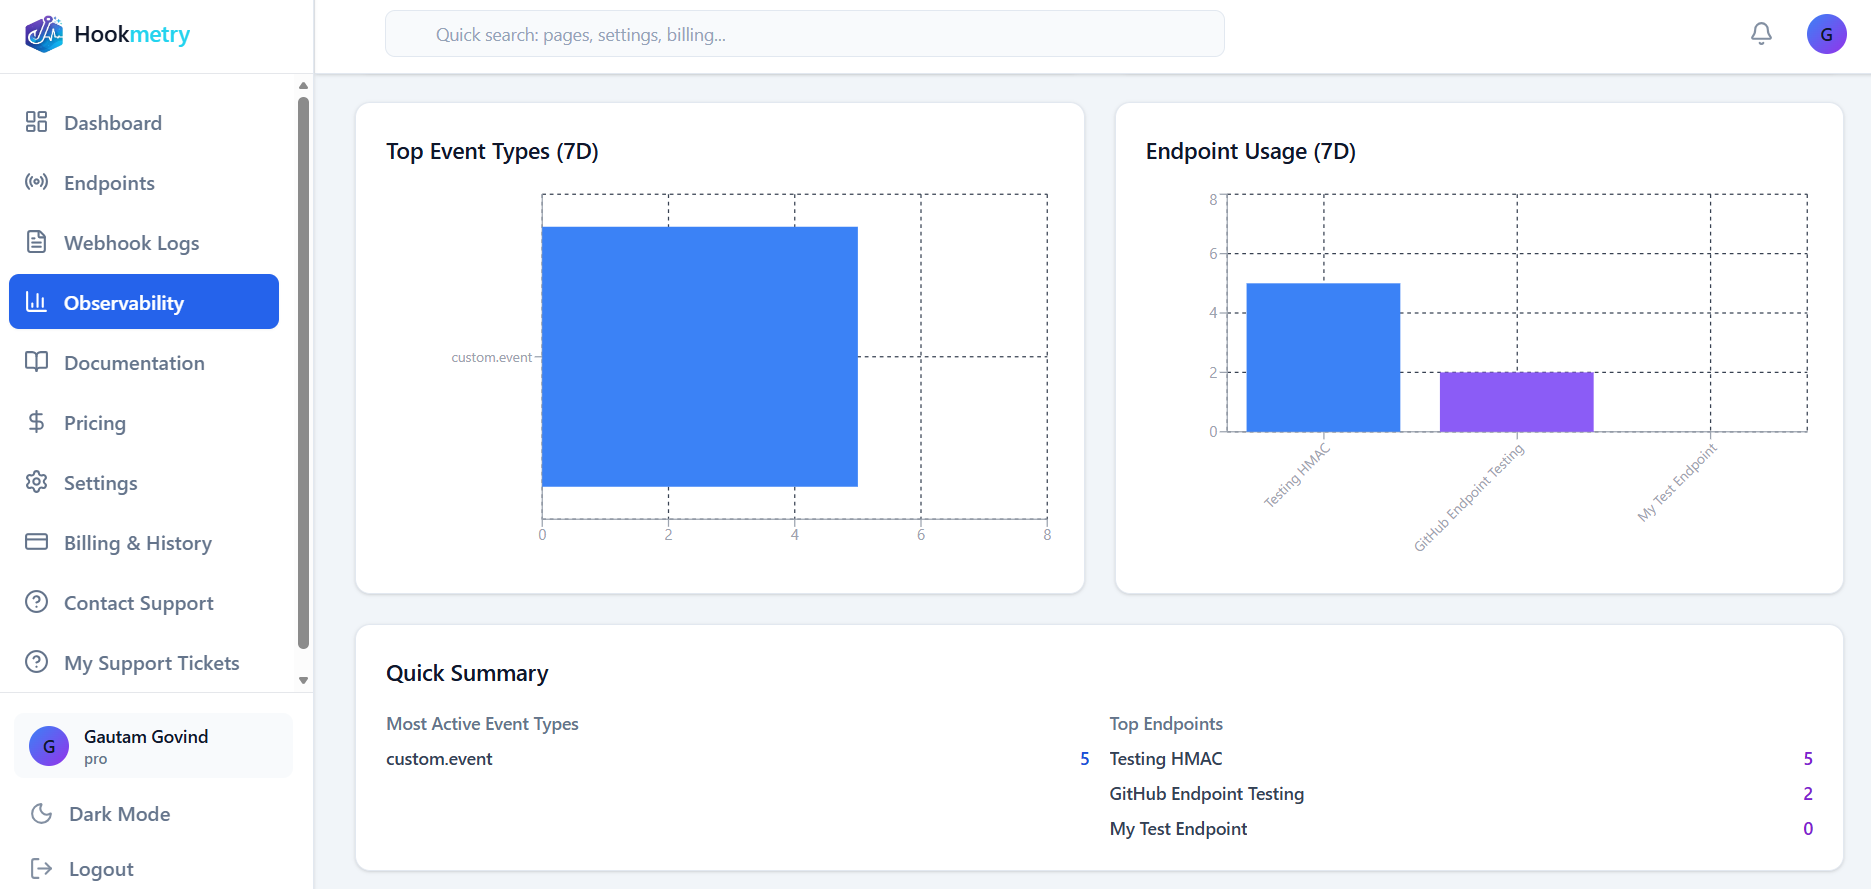
2. Webhook Observability & Metrics
Dive into the analytics. View detailed success rates, error spikes, and response time latency charts.
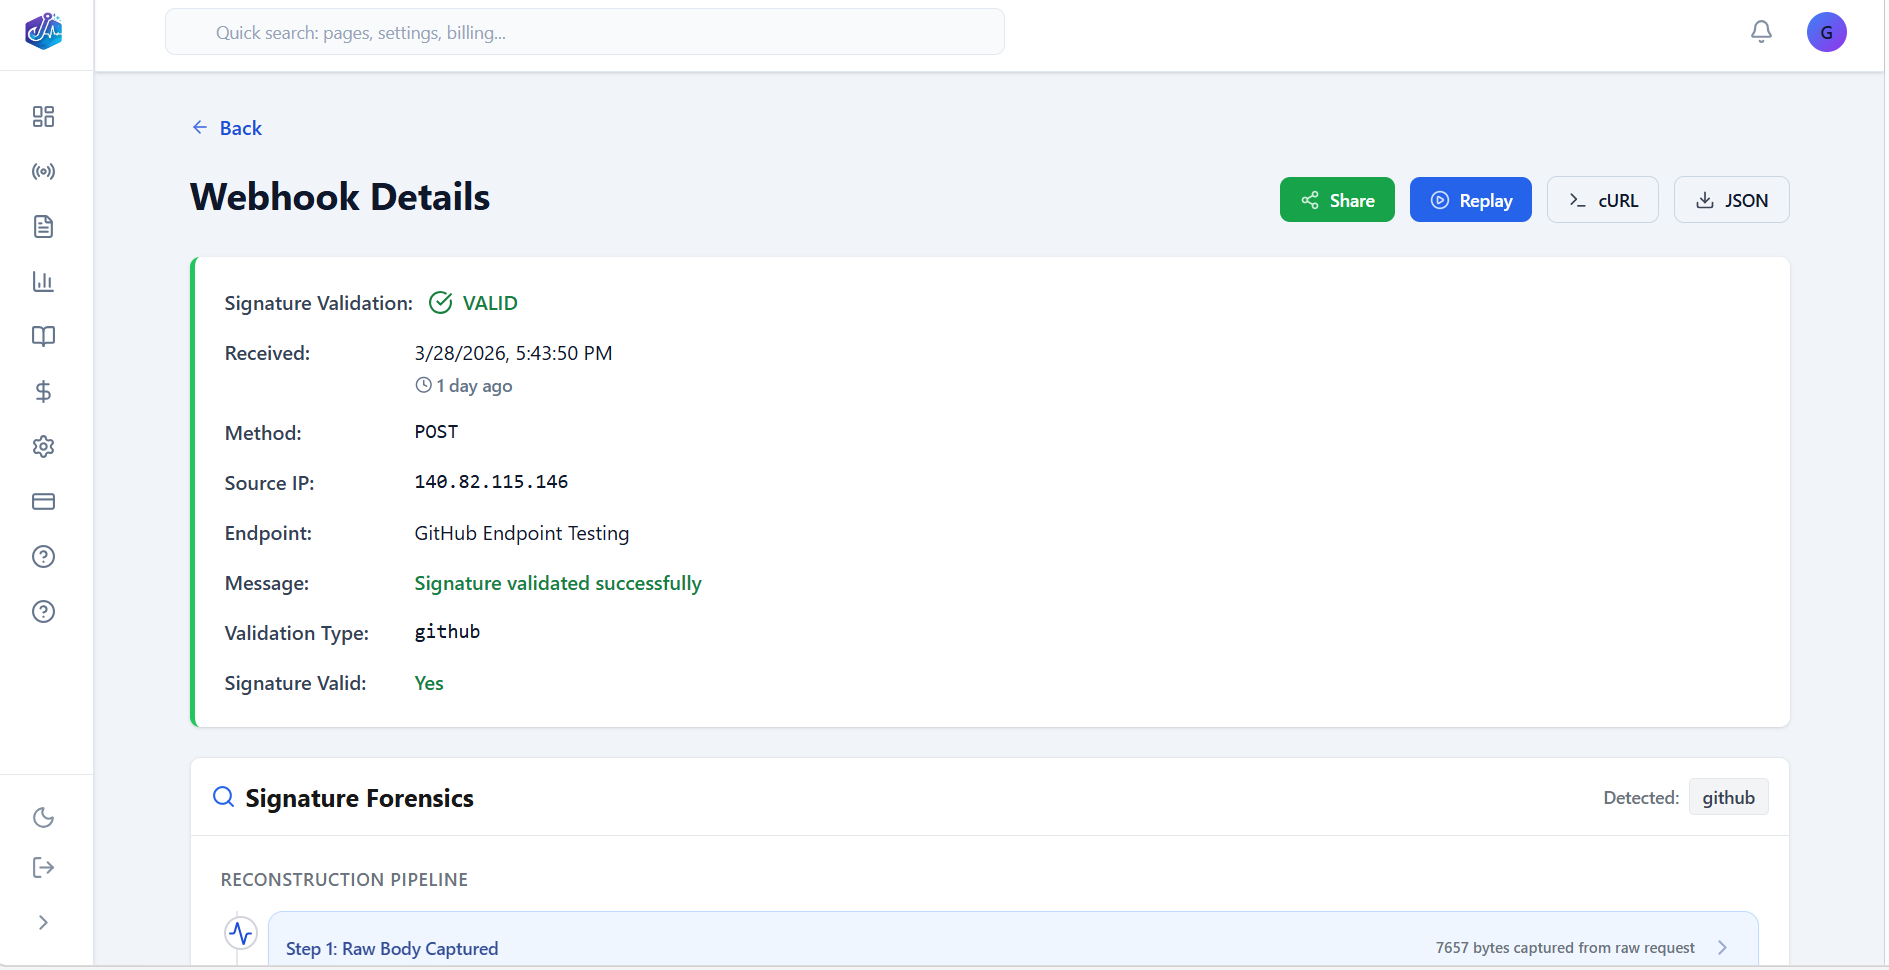
3. Payload Inspector & Headers
Drill down into individual requests. Inspect raw JSON payloads, custom provider headers, and exact timestamps.
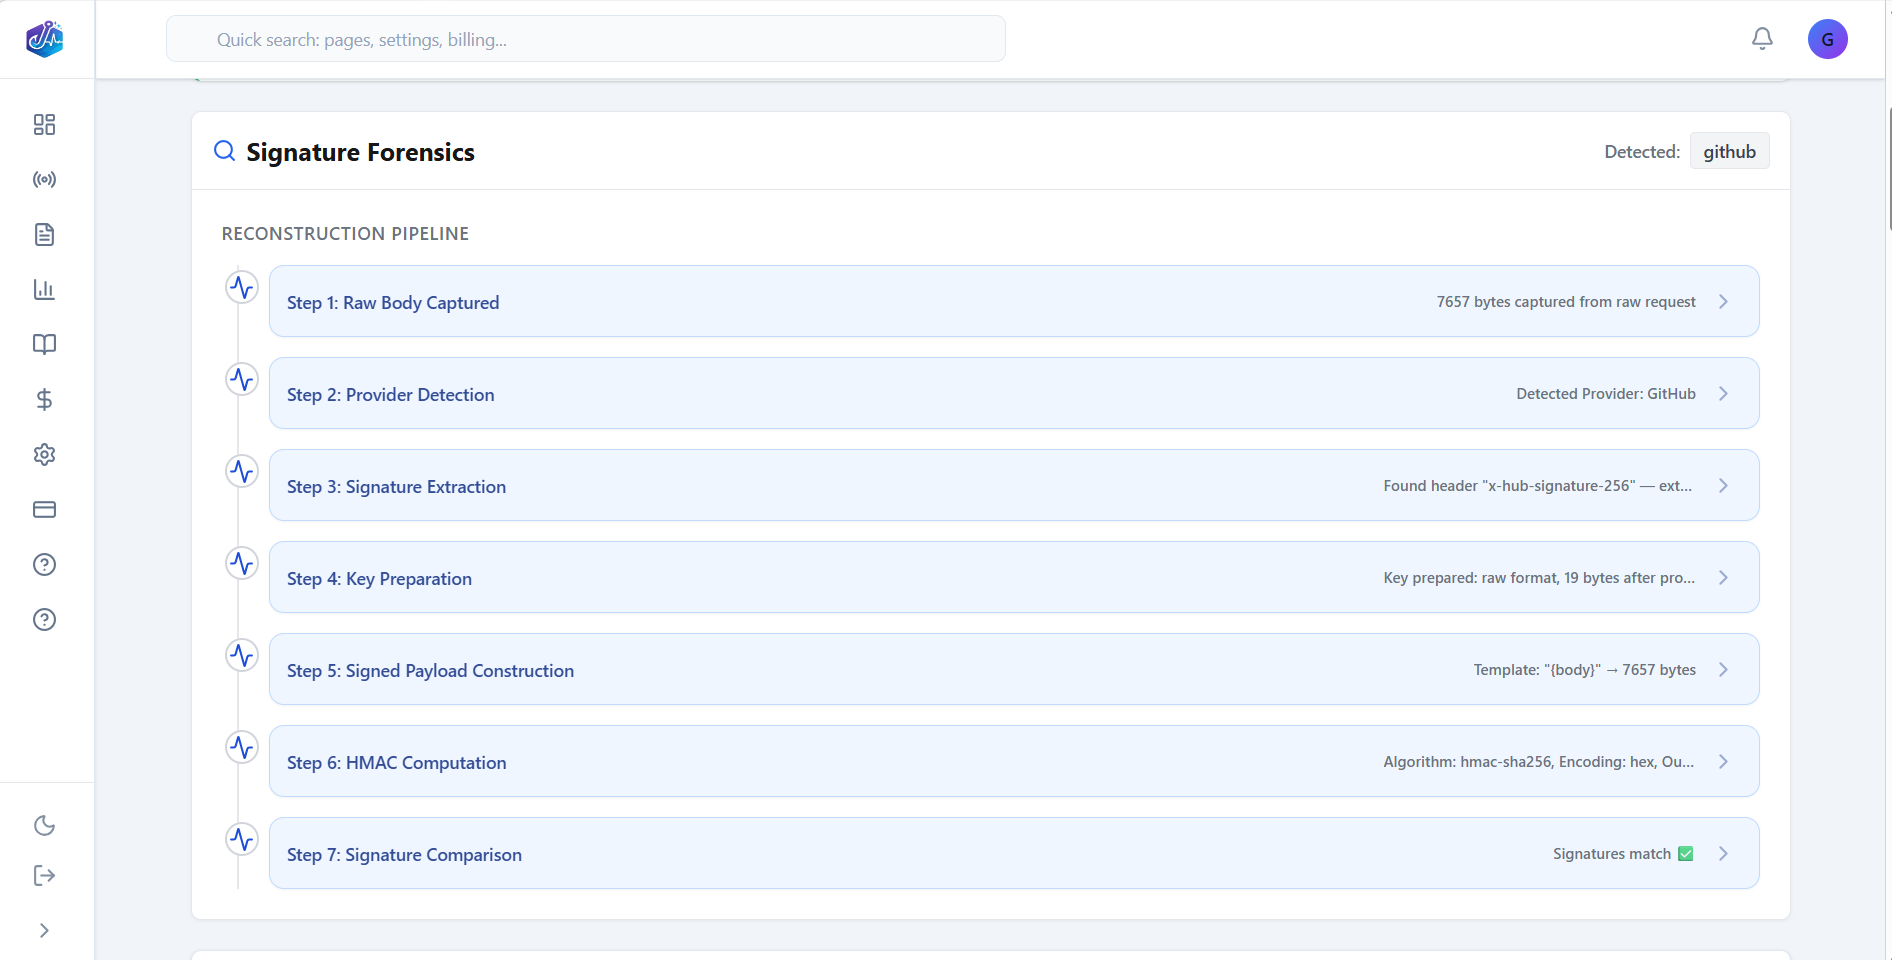
4. Structural Signature Forensics
When validation fails, Hookmetry tells you exactly why. Our Reconstruction Engine identifies encoding mismatches, malformed secrets, and bad prefixes.
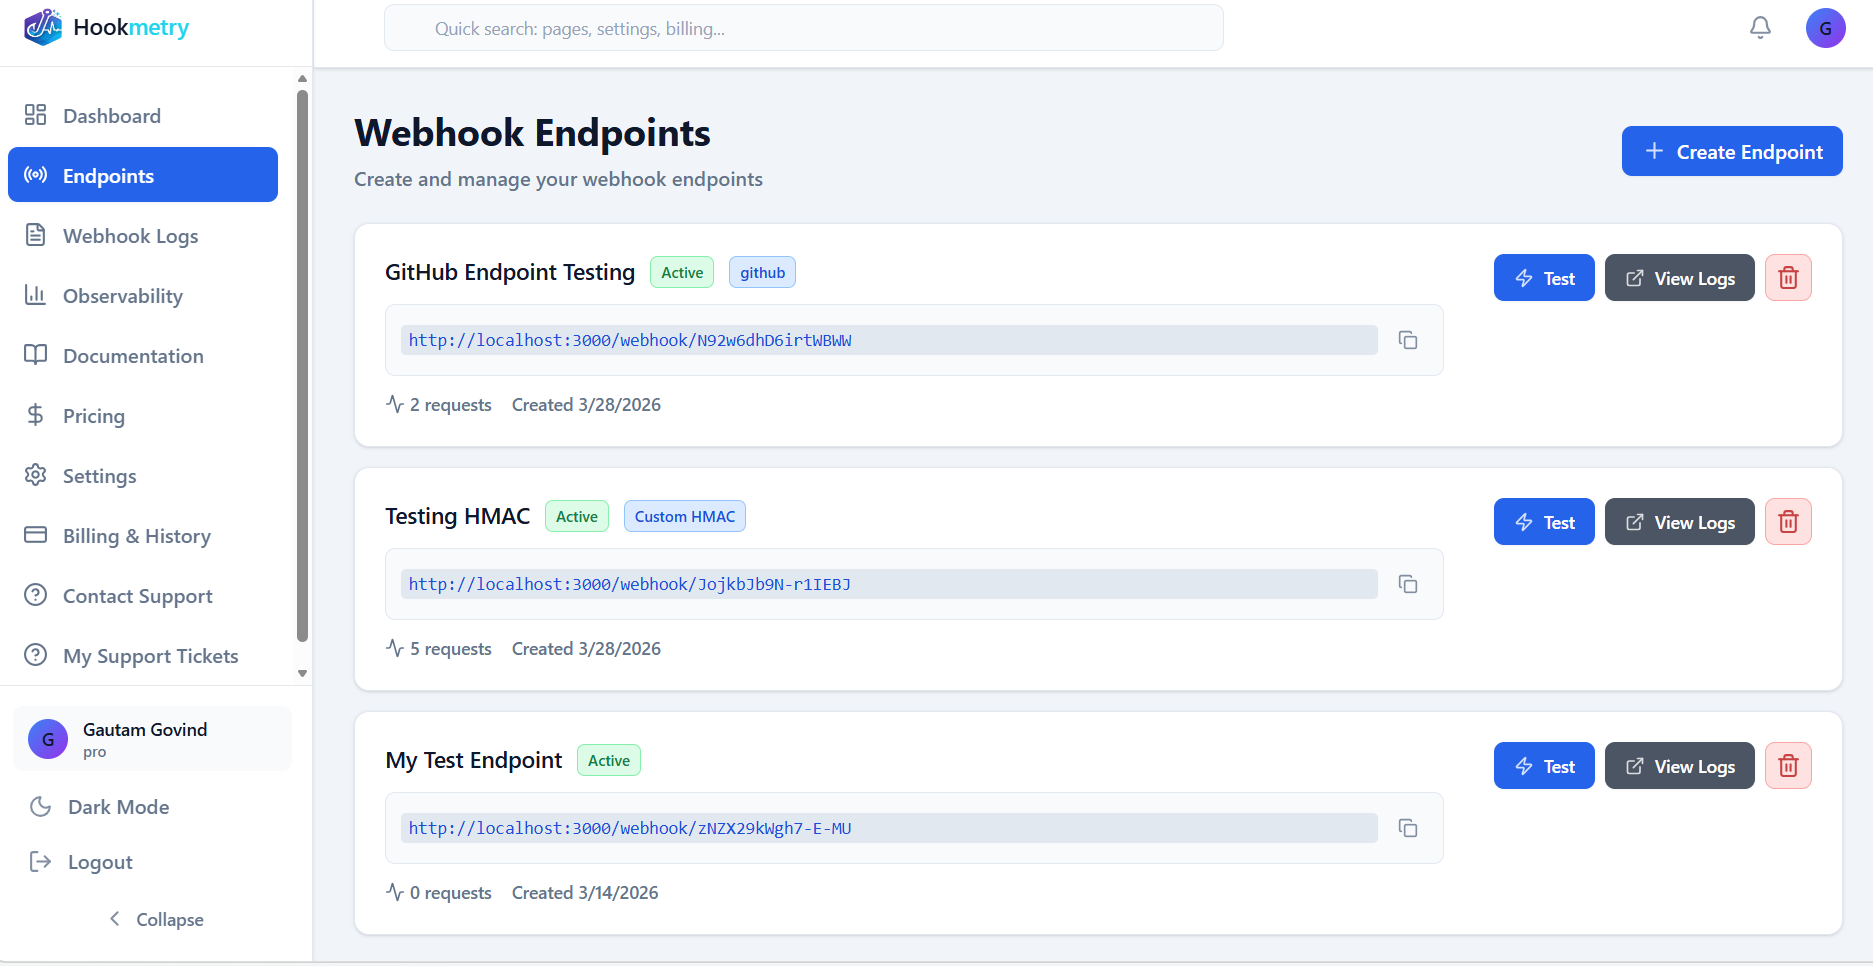
5. Live Integration Endpoints
Configure your listening endpoints for Stripe, GitHub, Shopify, and Svix with native secret validation builtin.
Was this page helpful?
Your feedback helps us improve the docs.