Documentation Menu
Observability & Analytics
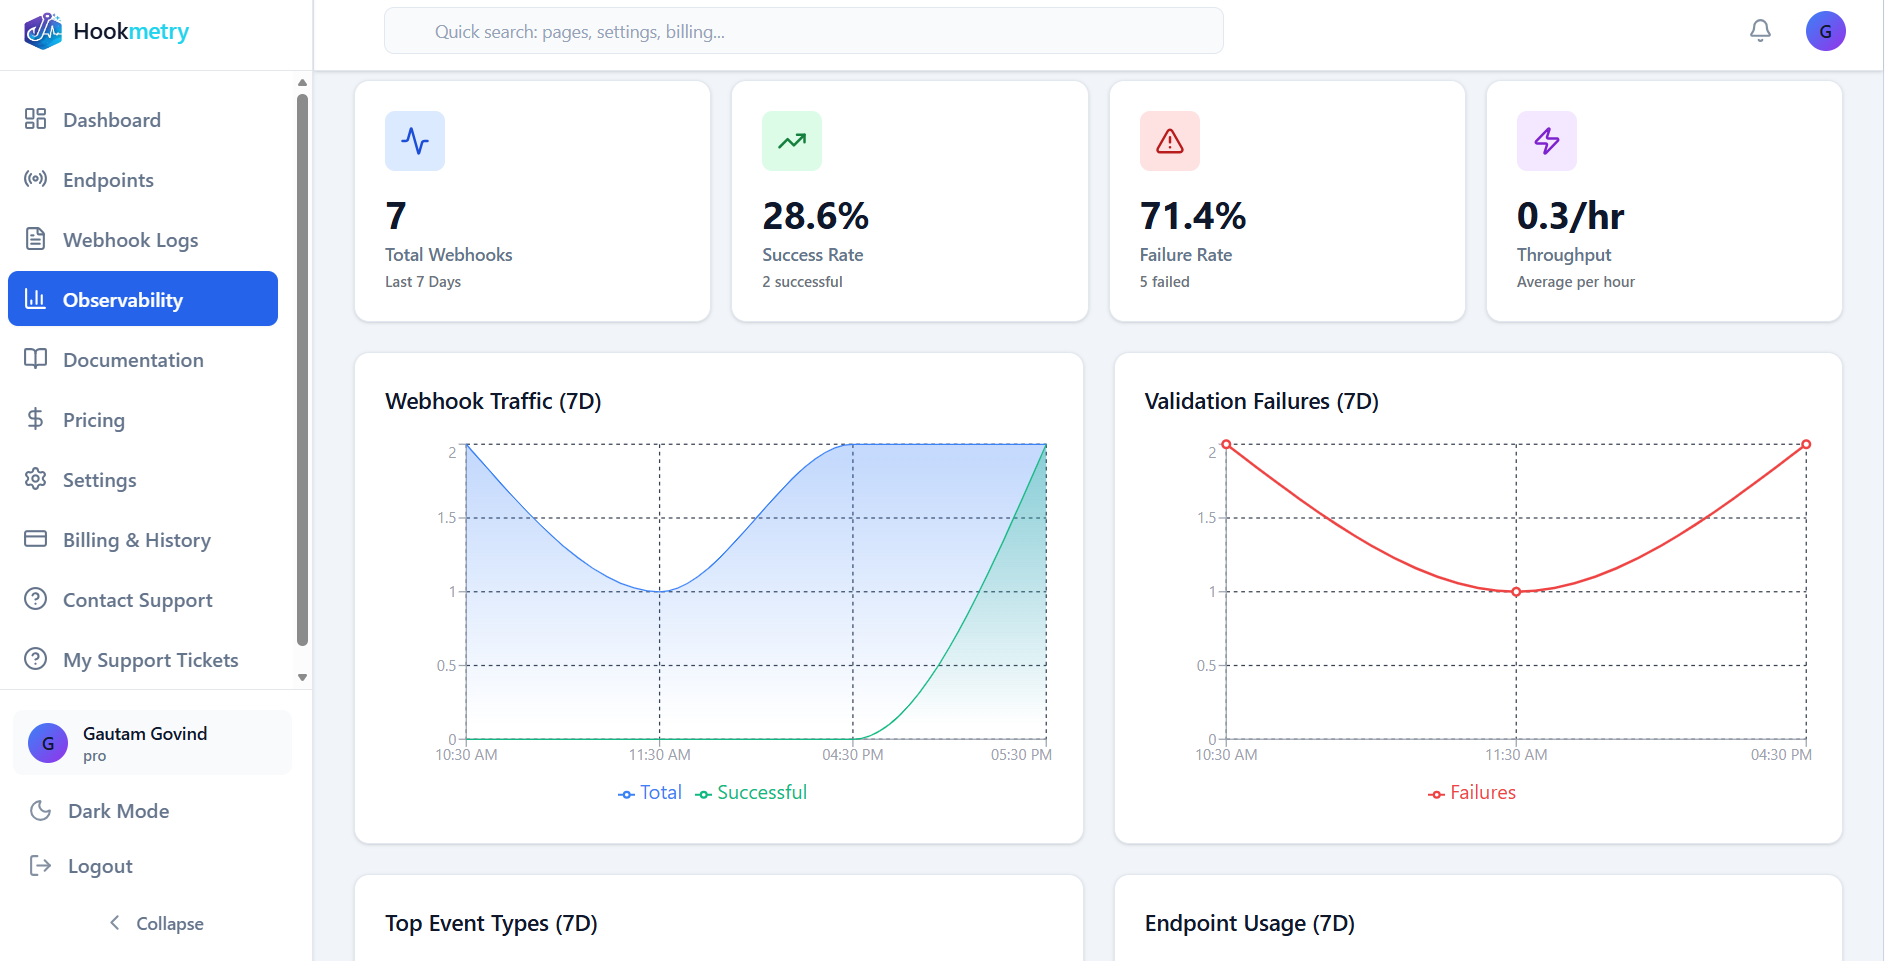
Track webhook performance, identify failures, and monitor quota usage with real-time metrics and analytics.
Dashboard Metrics
Success Rate
98.5%
Webhooks passing validation
Quota Usage
45 / 50
Today's requests
Avg Response
124ms
Endpoint response time
Failed Today
3
Signature mismatches
Time Filters
View metrics for different time ranges:
Last HourLast 24 HoursLast 7 DaysCustom Range
Using Metrics for Debugging
- Identify Failing Endpoints: Quickly see which endpoints have low success rates
- Spot Unusual Patterns: Notice traffic spikes or sudden failure increases
- Monitor Quota Limits: Get warned before reaching daily limits
- Track Validation Errors: See signature mismatch trends over time
Pro Tip:
Check the Observability dashboard first when debugging webhook issues. A sudden drop in success rate often indicates a configuration change or secret rotation.
Was this page helpful?
Your feedback helps us improve the docs.